Difference between revisions of "Arne Pommerening's Forest Biometrics & Quantitative Ecology Lab"
(→Publications relating to CRANCOD and forest structure) |
|||
| Line 62: | Line 62: | ||
== Sample input files == | == Sample input files == | ||
| − | The following data are from my management demonstration ( | + | The following data are from my management demonstration plot (MDP) 6 in Clocaenog Forest (North Wales) surveyed in 2004. This is an interesting site where a formerly mono-species Japanese larch plantation has gradually been colonised by Sitka spruce and other species (see the plot map at the top of this page). |
* Configuration file [[media:Clg6.cfg|Clg6.cfg]] | * Configuration file [[media:Clg6.cfg|Clg6.cfg]] | ||
| Line 70: | Line 70: | ||
== Sample output files == | == Sample output files == | ||
| − | These data also refer to | + | These data also refer to MDP 6 in Clocaenog Forest (North Wales) surveyed in 2004. |
* Protocol file logging all processes and presenting basic results [[media:Clg6_protocol.zip|Clg6_protocol.zip]] (please unzip) | * Protocol file logging all processes and presenting basic results [[media:Clg6_protocol.zip|Clg6_protocol.zip]] (please unzip) | ||
Revision as of 15:55, 7 January 2013

Contents
- 1 CRANCOD - A Program for the Analysis and Reconstruction of Spatial Forest Structure
- 2 Publications relating to CRANCOD and to forest structure
- 3 System requirements
- 4 Installation
- 5 Documentation
- 6 Sample input files
- 7 Sample output files
- 8 R scripts
- 9 Additional text resources
- 10 Feedback and cooperation
- 11 Recent workshops and (summer) schools involving CRANCOD
- 12 Disclaimer
CRANCOD - A Program for the Analysis and Reconstruction of Spatial Forest Structure
It is widely acknowledged that forest structure is a driving factor for growth, competition and birth & death processes which, in return, influence the structural composition of woodlands. Also any impact on forests - whether natual or human-induced - is primarily a change of forest structure.
In the last few decades an impressive number of structural indices (also referred to as nearest neigbour summary statistics [NNSS]) have been developed to quantify spatial forest structure. Of particular interest in this regard is the development of a family of individual tree neighbourhood-based indices, which are measures of small-scale variations in tree locations, species and dimensions, developed by Gadow and colleagues at Göttingen University (Germany). Especially when expressed as frequency distributions these indices offer valuable information on spatial woodland structure. Forest structure is closely correlated to and an expression of biodiversity at forest stand level (α diversity). Therefore the structural quantities used in CRANCOD play an important role as surrogate measures of biodiversity (Pommerening, 2002).
The CRANCOD program is a scientific laboratory for analysing and experimenting with nearest neighbour summary statistics and second-order characteristics. CRANCOD has been designed for use with large research plots including full enumerations of trees and in addition offers the opportunity to analyse forest inventory data consisting of multiple sample plots of circular or rectangular shape and varying plot size based on a systematic grid. The program has inbuilt flexibility with the user able to select the number of neighbour trees and to choose between six different methods of edge correction. CRANCOD can, of course, also be used to analyse research and sample plots without spatial information (stand analysis).
The integrated sampling simulator ISIS allows the simulation of sampling with systematic selection of sample plots of varying plot geometry.
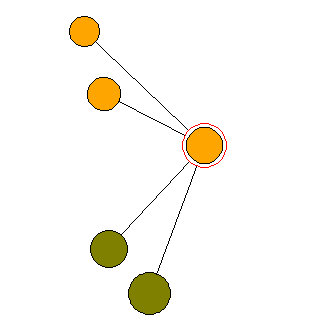
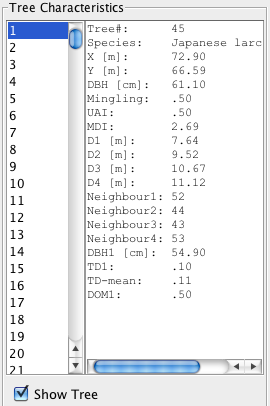
Saving individual-tree results in addition to the summary files provides the opportunity to carry out individual tree based follow-up research. A special visualisation tool allows the user to visually explore nearest neighbour summary statistics. Tree species codings and colours can be flexibly edited externally. A number of language options allow optimal adaptation of the program in different countries.
The philosophy and objectives of the program are described in greater detail in the user manual and in the papers given below. The publications also describe experiments and investigations that can be carried out with CRANCOD.
Author, copyrights and contact: Prof. Dr. Arne Pommerening, Bern University of Applied Sciences, School of Agricultural, Forest and Food Sciences. Email: arne.pommerening@bfh.ch
Software version: 1.4
Copyright and licenses: The core version of CRANCOD is a public domain software. However, the program is protected by intellectual property rights and users are expected to acknowledge CRANCOD and its developer when publishing results.
Publications relating to CRANCOD and to forest structure
Pommerening, A., 2002. Approaches to quantifying forest structures. Forestry 75, 305-324. [PdF file]
Pommerening, A., 2006. Evaluating structural indices by reversing forest structural analysis. For. Ecol. Manage. 224, 266–277. [PdF file]
Pommerening, A. and Stoyan, D., 2006. Edge-correction needs in estimating indices of spatial forest structure. Can. J. For. Res. 36, 1723–1739. [PdF file]
Mason, W. L., Connolly, T., Pommerening, A. and Edwards, C., 2007. Spatial structure of semi-natural and plantation stands of Scots pine (Pinus sylvestris L.) in northern Scotland. Forestry 80, 567-586. [PdF file]
Pommerening, A. and Stoyan, D., 2008. Reconstructing spatial tree point patterns from nearest neighbour summary statistics measured in small subwindows. Can. J. For. Res. 38, 1110–1122. [PdF file]
Pommerening, A., 2008. Analysing & modelling spatial woodland structure. Habilitation thesis BOKU University Vienna. Bangor, 145p. [PdF file]
Davies, O. and Pommerening, A., 2008. The contribution of structural indices to the modelling of Sitka spruce (Picea sitchensis) and birch (Betula spp.) crowns. For. Ecol. Manage. 256, 68–77. [PdF file]
Crecente-Campo, F., Pommerening, A. and Rodríguez-Soalleiro, R., 2009. Impacts of thinning on structure, growth and risk of crown fire in a Pinus sylvestris L. plantation in northern Spain. For. Ecol. Manage. 257, 1945-1954. [PdF file]
Motz, K., Sterba, H. and Pommerening, A., 2010. Sampling measures of tree diversity. For. Ecol. Manage. 260, 1985–1996. [PdF file]
Pommerening, A., LeMay, V. and Stoyan, D., 2011. Model-based analysis of the influence of ecological processes on forest point pattern formation - A case study. Ecol. Model.. 222, 666-678. [PdF file]
Pommerening, A., Gonçalves, A. C. and Rodríguez-Soalleiro, R., 2011. Species mingling and diameter differentiation as second-order characteristics. Allg. Forst- u. J.-Ztg. 182, 115-129. [PdF file]
Gonçalves, A. C. and Pommerening, A., 2011. Spatial dynamics of cone production in Mediterranean climates: A case study of Pinus pinea L. in Portugal. For. Ecol. Manage. 266, 83–93. [PdF file]
Gadow, K. v., Zhang, C. Y., Wehenkel, C., Pommerening, A., Corral-Rivas, J., Korol, M., Myklush, S., Hui, G. Y., Kiviste, A. and Zhao, X. H., 2012. Forest structure and diversity, 29 - 83. In: Pukkala, T. and Gadow, K. v. (Eds.), 2012: Continuous cover forestry. 2nd edition. Managing Forest Ecosystems 23. Springer. Dordrecht, 296p. [PdF file]

System requirements
As with any Java application CRANCOD can be used on Windows, Linux and Macintosh computers:
- Windows XP, Vista, 7
- Mac OS X
- Equivalent Linux version
- Java Runtime Environment (JRE)
Installation
- Download the file Crancod.zip onto your computer and unzip it.
- Save the file Crancod.jar on your computer's desktop or in a dedicated target folder.
- If not previously installed download and install the Java Runtime Environment (JRE).
- Launch the CRANCOD program by double clicking on the file Crancod.jar.
Documentation
- Download the user manual here.
- Check out the (slightly) updated poster presentation of CRANCOD at the annual conference of the British Ecological Society in 2006.
Sample input files
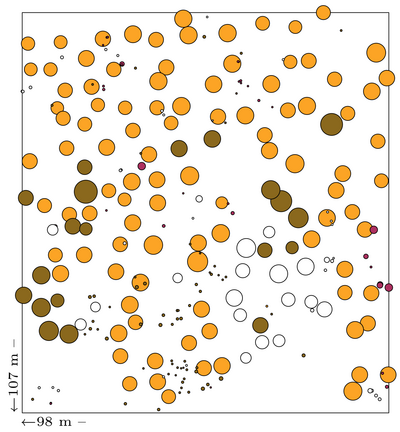
The following data are from my management demonstration plot (MDP) 6 in Clocaenog Forest (North Wales) surveyed in 2004. This is an interesting site where a formerly mono-species Japanese larch plantation has gradually been colonised by Sitka spruce and other species (see the plot map at the top of this page).
- Configuration file Clg6.cfg
- Tree data file Clg6.dat
- Geometry file Clg6.geo
- Species file Clg6.species
Sample output files
These data also refer to MDP 6 in Clocaenog Forest (North Wales) surveyed in 2004.
- Protocol file logging all processes and presenting basic results Clg6_protocol.zip (please unzip)
- File containing all non-spatial results Clg6_NonSpatials_org.out
- File containing all spatial results (NNSS) Clg6_Spatials_org.out
- File with second-order characteristics Clg6_corr_org.out
- File with individual tree results Clg6_tree_org.out
Clg6_protocol.html is an HTML file and can be opened and viewed with any internet browser. All files with the extension *.out are ASCII files and can be opened and viewed in MS Excel.
R scripts
Some of the functionality of CRANCOD and other methods have also been implemented in the R language. When using R scripts from the list below for research purposes please acknowledge the author.
- Download the script TreeDiversityIndices.R to calculate distance distribution, diameter differentiation, mingling, dominance, mean directional index and the mark variogram index along with the Clocaenog 6 sample data. The script was used in Pommerening et al. (2011). Last updated on 04.07.2012.
- Download the script StandAnalysis.R to calculate basal area, trees per hectare, mean diameters, height diameter regression, top height/diameter, diameter distribution and Shannon index along with the Clocaenog 6 sample data. Last updated on 06.07.2012.
- Download the script WenkRegression.R to model volume and height development of single stem analysis trees for identifying unusual growth patterns along with sample data from a Sitka spruce tree in Gwydyr forest (North Wales). For the corresponding theory refer to Wenk (1994), an excerpt from the 2005 Tyfiant Coed report and Murphy and Pommerening (2010). Last updated on 12.06.2012.
- Download the script MarkVariogram.R to calculate the mark variogram along with the Clocaenog 6 sample data. Last updated on 11.06.2012.
- Download the script MeanOfAngles.R to calculate the mean-of-angles index (Assunção, 1994) with periodic boundary conditions. Last updated on 21.09.2012.
- Download the script Construction.R to simulate a point pattern with a user-defined value of the aggregation index by Clark and Evans (1954) with periodic boundary conditions along with a short documentation. Last updated on 07.01.2013.
Additional text resources
Visitors of this website who are unfamiliar with the topic of forest structure analysis and forestry summary characteristics may want to read the following documents:
- General text on the importance of forest structure
- Text on forestry summary characteristics and their estimation
Feedback and cooperation
The developer of the CRANCOD software and the R scripts is particularly interested in feedback concerning any aspect of the program to improve its functionality and usefulness in future versions. Please report your feedback to arne.pommerening@bfh.ch. The author is very open to any kind of cooperation, particularly in terms of joint publications, and it would also be possible to manage CRANCOD as an open-source software with an international project team in the future.
Recent workshops and (summer) schools involving CRANCOD
- Lectures on forest growth and yield at Göttingen University (Germany), 23 - 27 July 2012
- "Analysing & Modelling Spatial Forest Structure – an Introduction" at Tartu University, Estonia, 8 - 12 October 2012
Disclaimer
The CRANCOD software, all its libraries and algorithms and the R scripts have been prepared with great care. However, neither the developer nor Bern University of Applied Sciences can be made liable in the unlikely case of damage caused to your computer while using CRANCOD or of incorrect outputs.

