Difference between revisions of ""Analysis of human tree selection behaviour". Lectures at Göttingen University, Germany, 19 - 21 June 2014."
From Arne Pommerening's Forest Biometrics Lab
(→Additional material) |
|||
| Line 1: | Line 1: | ||
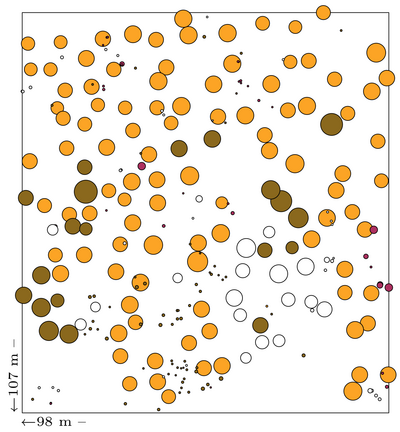
| + | [[File:plot6.png|400px|thumb|Tree location map of Clocaenog plot 6. Orange: Japanese larch (''Larix kaempferi'' | ||
| + | (Lamb.) Carr.), Olive: Sitka spruce (''Picea sitchensis'' | ||
| + | (Bong.) Carr.), Maroon: Rowan (''Sorbus aucuparia'' L.), White: other species (including Scots pine, lodgepole pine, Norway spruce, sessile oak, ash, birch, willow and holly). The size of the circles are scaled by stem diameter at 1.3 m above ground level. The map was prepared with the R script [[Woodland_Structure_Analysis_and_Modelling_Lab#Selected_R_scripts_and_C++_files|TreeDiversityIndices.R]] in conjunction with the spatstat package.]] | ||
| + | |||
Here you can find some material relating to the lectures. | Here you can find some material relating to the lectures. | ||
Revision as of 15:44, 16 June 2014

Tree location map of Clocaenog plot 6. Orange: Japanese larch (Larix kaempferi (Lamb.) Carr.), Olive: Sitka spruce (Picea sitchensis (Bong.) Carr.), Maroon: Rowan (Sorbus aucuparia L.), White: other species (including Scots pine, lodgepole pine, Norway spruce, sessile oak, ash, birch, willow and holly). The size of the circles are scaled by stem diameter at 1.3 m above ground level. The map was prepared with the R script TreeDiversityIndices.R in conjunction with the spatstat package.
Here you can find some material relating to the lectures.
Introduction to R (19.06.2014)
- Guide RguideAp.pdf
- R code and data files InitialR.zip
Lectures on tree selection behaviour (20.06.2014)
- Handout part 1 ExperimentalSilviculture02H1.pdf
- Handout part 2 ExperimentalSilviculture02H2.pdf
- Handout part 3 ExperimentalSilviculture02H3.pdf
- Handout part 4 ExperimentalSilviculture02H4.pdf
- R code and data files MarteloscopeR.zip